Special | A | B | C | D | E | F | G | H | I | J | K | L | M | N | O | P | Q | R | S | T | U | V | W | X | Y | Z | ALL
R |
|---|
Reference sea levelTheobservedelevationdifferencesbetweengeodetic benchmarksareprocessedthroughleast-squares adjustmentsto determine orthometric heights referred to a common vertical reference surface, which is the reference sea level. In this way, height values of all benchmarks in the vertical control portion of a surveying agency are made consistent and can be compared directly to determine differences of elevation between benchmarks in a geodetic reference system that may not be directly connected by lines of geodetic levelling. This important vertical geodetic control system is made possible by a universally accepted, reference sea level. | |
Refraction diagramsModels using water depths, direction of wave, separation angle, and ray separation between two adjacent rays as input, produce the path of wave orthogonals, refraction coefficients, wave heights, and travel times. | |
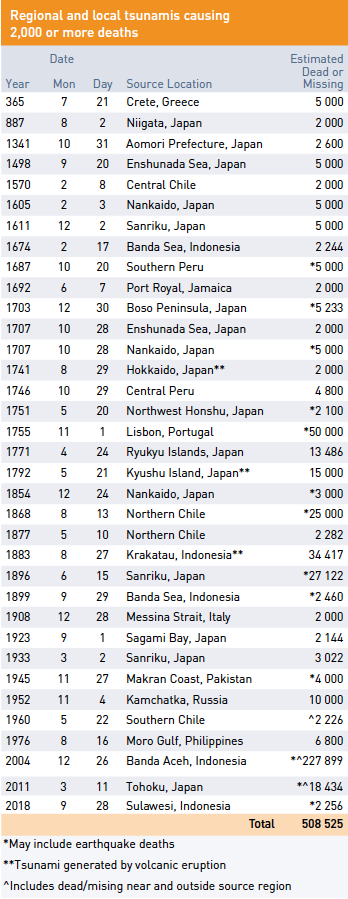
Regional tsunamiA tsunami capable of destruction in a particular geographic region, generally within 1,000 km or 1-3 hours tsunami travel time from its source. Regional tsunamis also occasionally have very limited and localized effects outside the region. Most destructive tsunami can be classified as local or regional. It follows many tsunami related casualties and considerable property damage also comes from these tsunamis. Between 1980 and 2017 there were 34 local or regional tsunamis that resulted in nearly 252,000 deaths and billions of dollars in property damage; 24 of these were in the Pacific and adjacent seas. For example, in the Pacific, a regional tsunami in 1983 in the Sea of Japan severely damaged coastal areas of Japan, Korea, and Russia causing more than $800 million in damage, and more than 100 deaths. Then, after nine years with only one event causing one fatality, 10 locally destructive tsunamis occurred in just a seven-year period from 1992 to 1998, resulting in over 2,700 deaths and hundreds of millions of dollars in property damage. In most of these cases, tsunami mitigation efforts in place at the time were unable to prevent significant damage and loss of life. However, losses from future local or regional tsunamis can be reduced if a denser network of warning centres, seismic and water-level reporting stations, and better communications are established to provide a timely warning, and if better programmes of tsunami preparedness and education can be put in place.
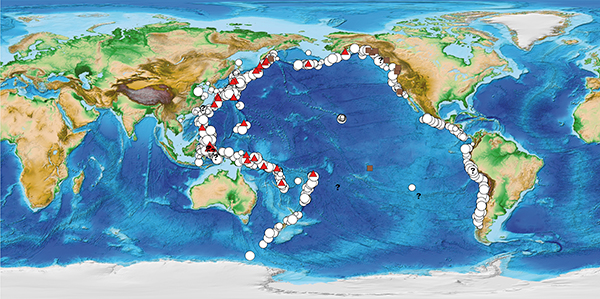
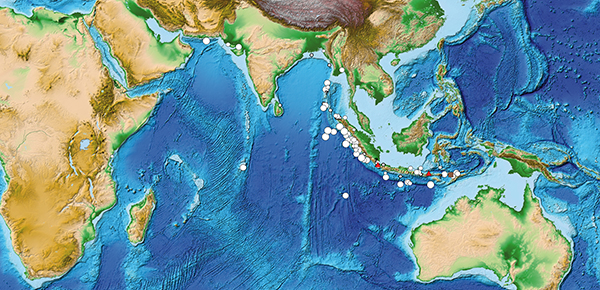
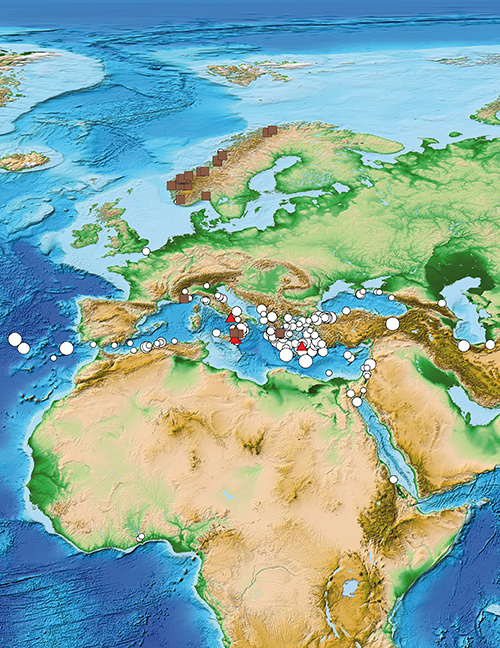
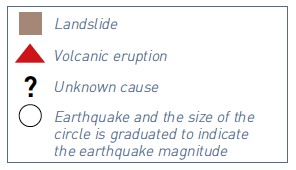
The four images above show confirmed tsunami source locations in the Pacific Ocean, Indian Ocean, Mediterranean Sea, and Caribbean Sea. The symbols indicate cause of the tsunami: Brown Square is a landslide, Red Triangle is a volcanic eruption, Question Mark is an unknown cause, and White Circle is an earthquake and the size of the circle is graduated to indicate the earthquake magnitude. Source: NCEI/WDS-Geophysics.
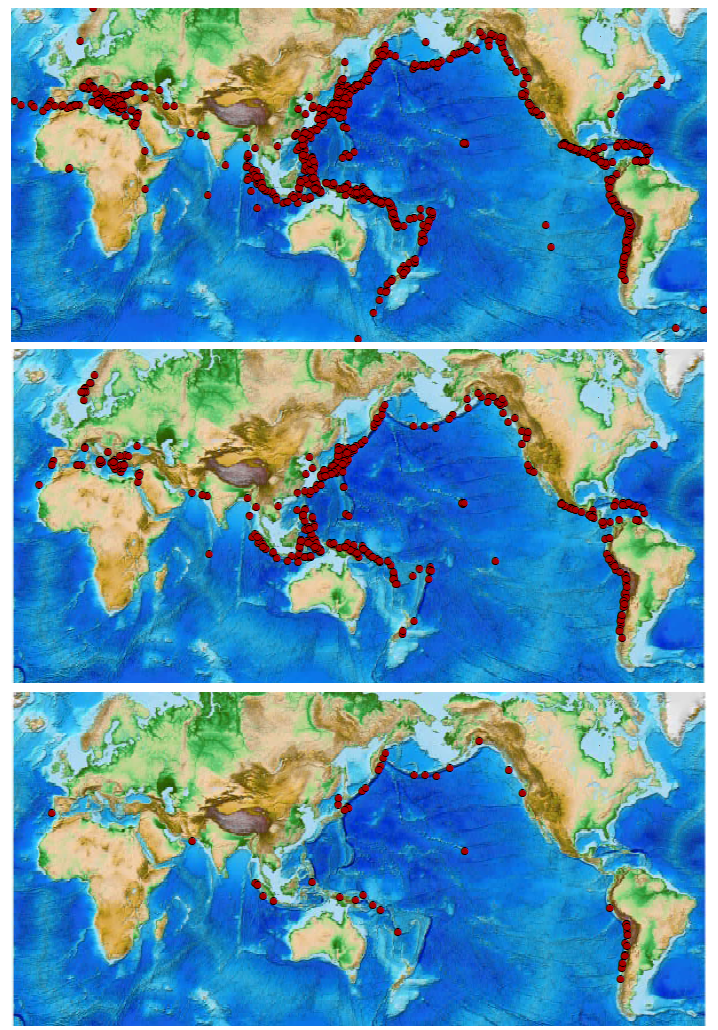
More than 80% of the world’s tsunamis were caused by earthquakes and over 70% of these were observed in the Pacific where large earthquakes occur as tectonic plates are subducted along the Pacific Ring of Fire. Top: Epicentre of all tsunamigenic earthquakes tsunamis have caused damage locally in all ocean basins. Middle: Locations of earthquakes, volcanic eruptions, and landslides generating tsunamis that caused damage or casualties locally. Although the majority of tsunamis that were observed more than 1,000 km away (teletsunamis) were generated by earthquakes in the Pacific, teletsunamis have also caused damage and casualties in the Indian and Atlantic oceans. Bottom: Source locations of teletsunamis generated by earthquakes or volcanic eruptions causing damage or casualties. These data are based on historical records. Source: NGDC / WDS-Geophysics. | |


RiseThe upward change or elevation in sea level associated with a tsunami, a tropical cyclone, storm surge, the tide, or other long term climatic effect. | |
Runup1. Difference between the elevation of maximum tsunami penetration (inundation line) and the sea level at the time of the tsunami. In practical terms, runup is only measured where there is a clear evidence of the inundation limit on the shore. 2. Elevation reached by seawater measured relative to some stated datum such as mean sea level, mean low water, sea level at the time of the tsunami attack, etc., and measured ideally at a point that is a local maximum of the horizontal inundation. Where the elevation is not measured at the maximum of horizontal inundation, this is often referred to as the inundation-height.
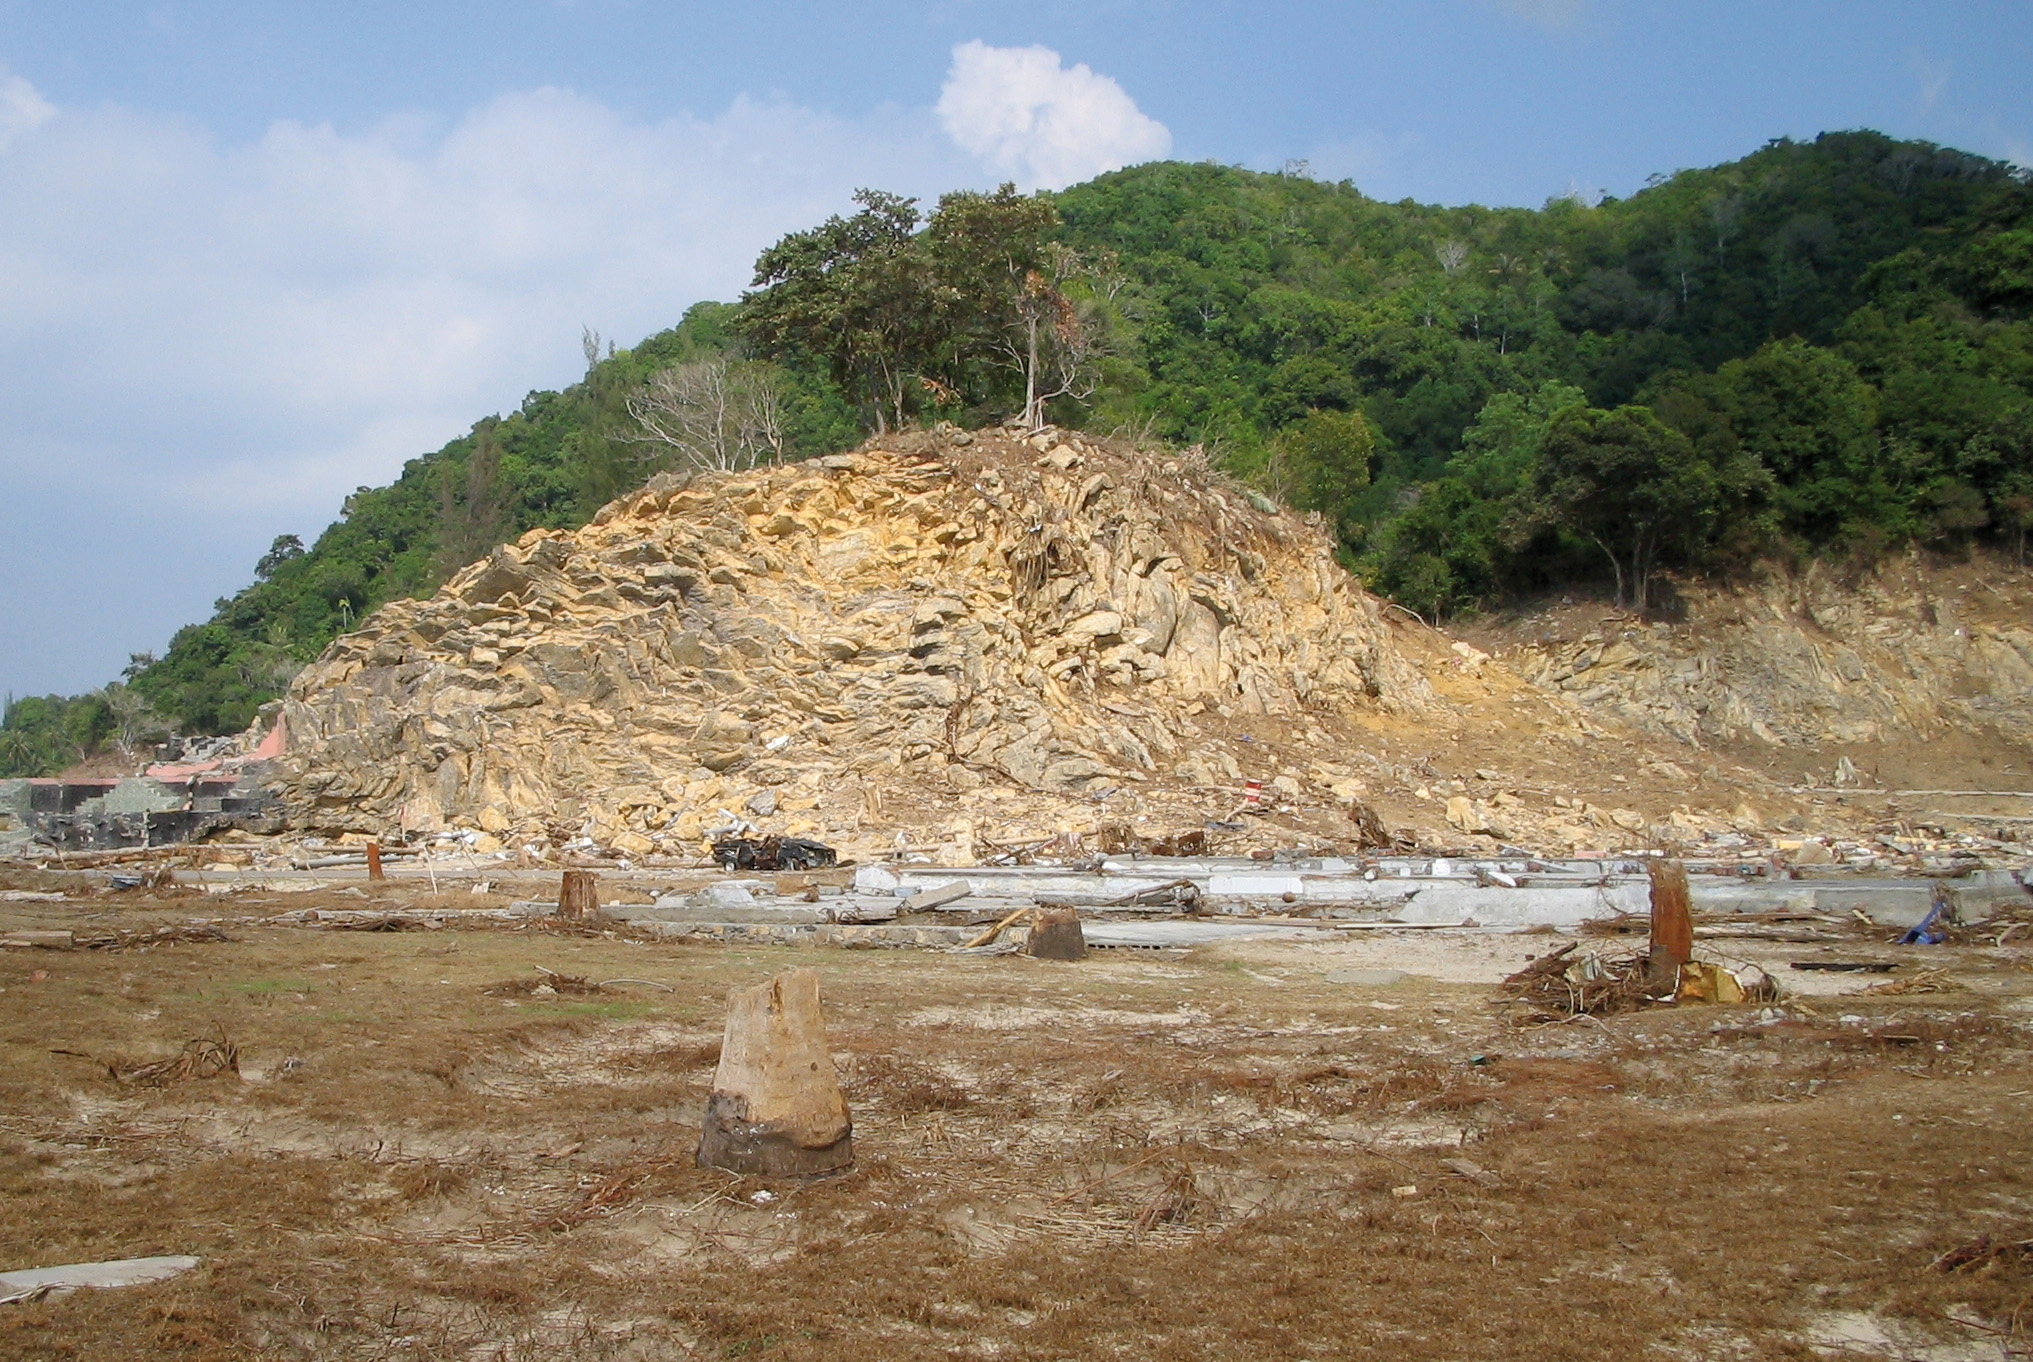
Tsunami stripped forested hills of vegetation leaving clear marker of tsunami runup, Banda Aceh, 26 December 2004 Sumatra tsunami. Photo courtesy of Yuichi Nishimura, Hokkaido University.
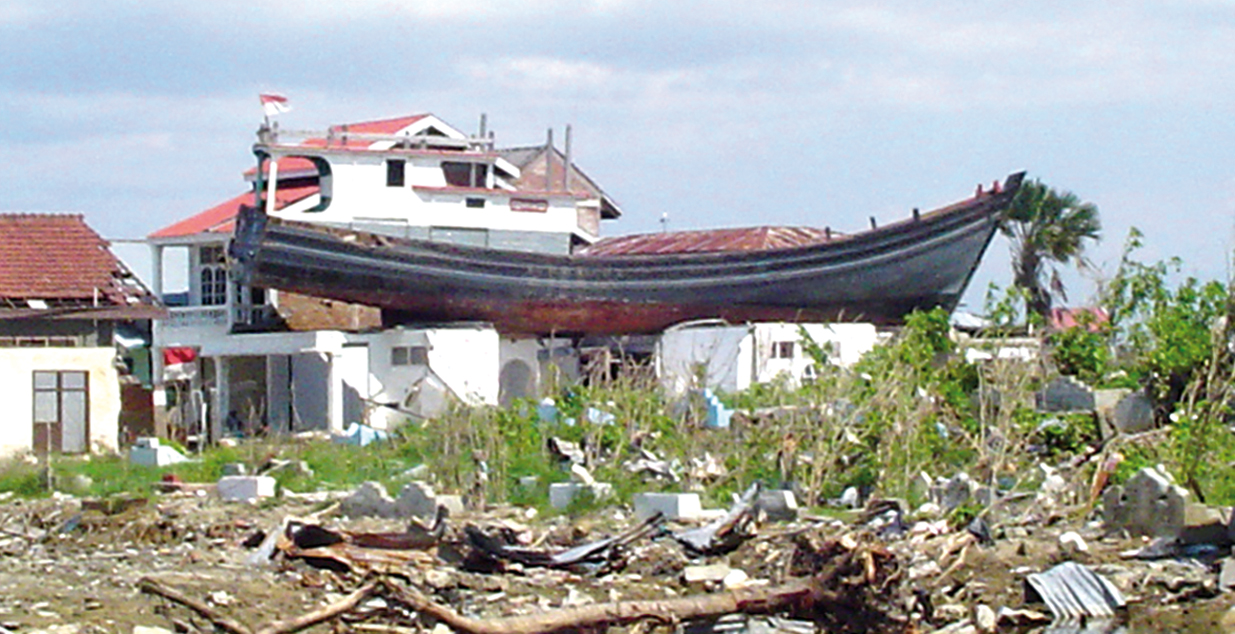
Runup can often be inferred from the vertical extent of dead vegetation, from debris normally found at ground level that are observed stuck on electric wires, in trees, or at other heights, and from water line marks left on building walls. In extreme cases, cars, boats, and other heavy objects have been lifted and deposited atop buildings. Banda Aceh, Indonesia, 26 December 2004. Photo courtesy of C. Courtney, Tetra Tech EMI. | |
Runup distributionSet of tsunami runup values measured or observed along a coastline. | |